What is ChartAI?
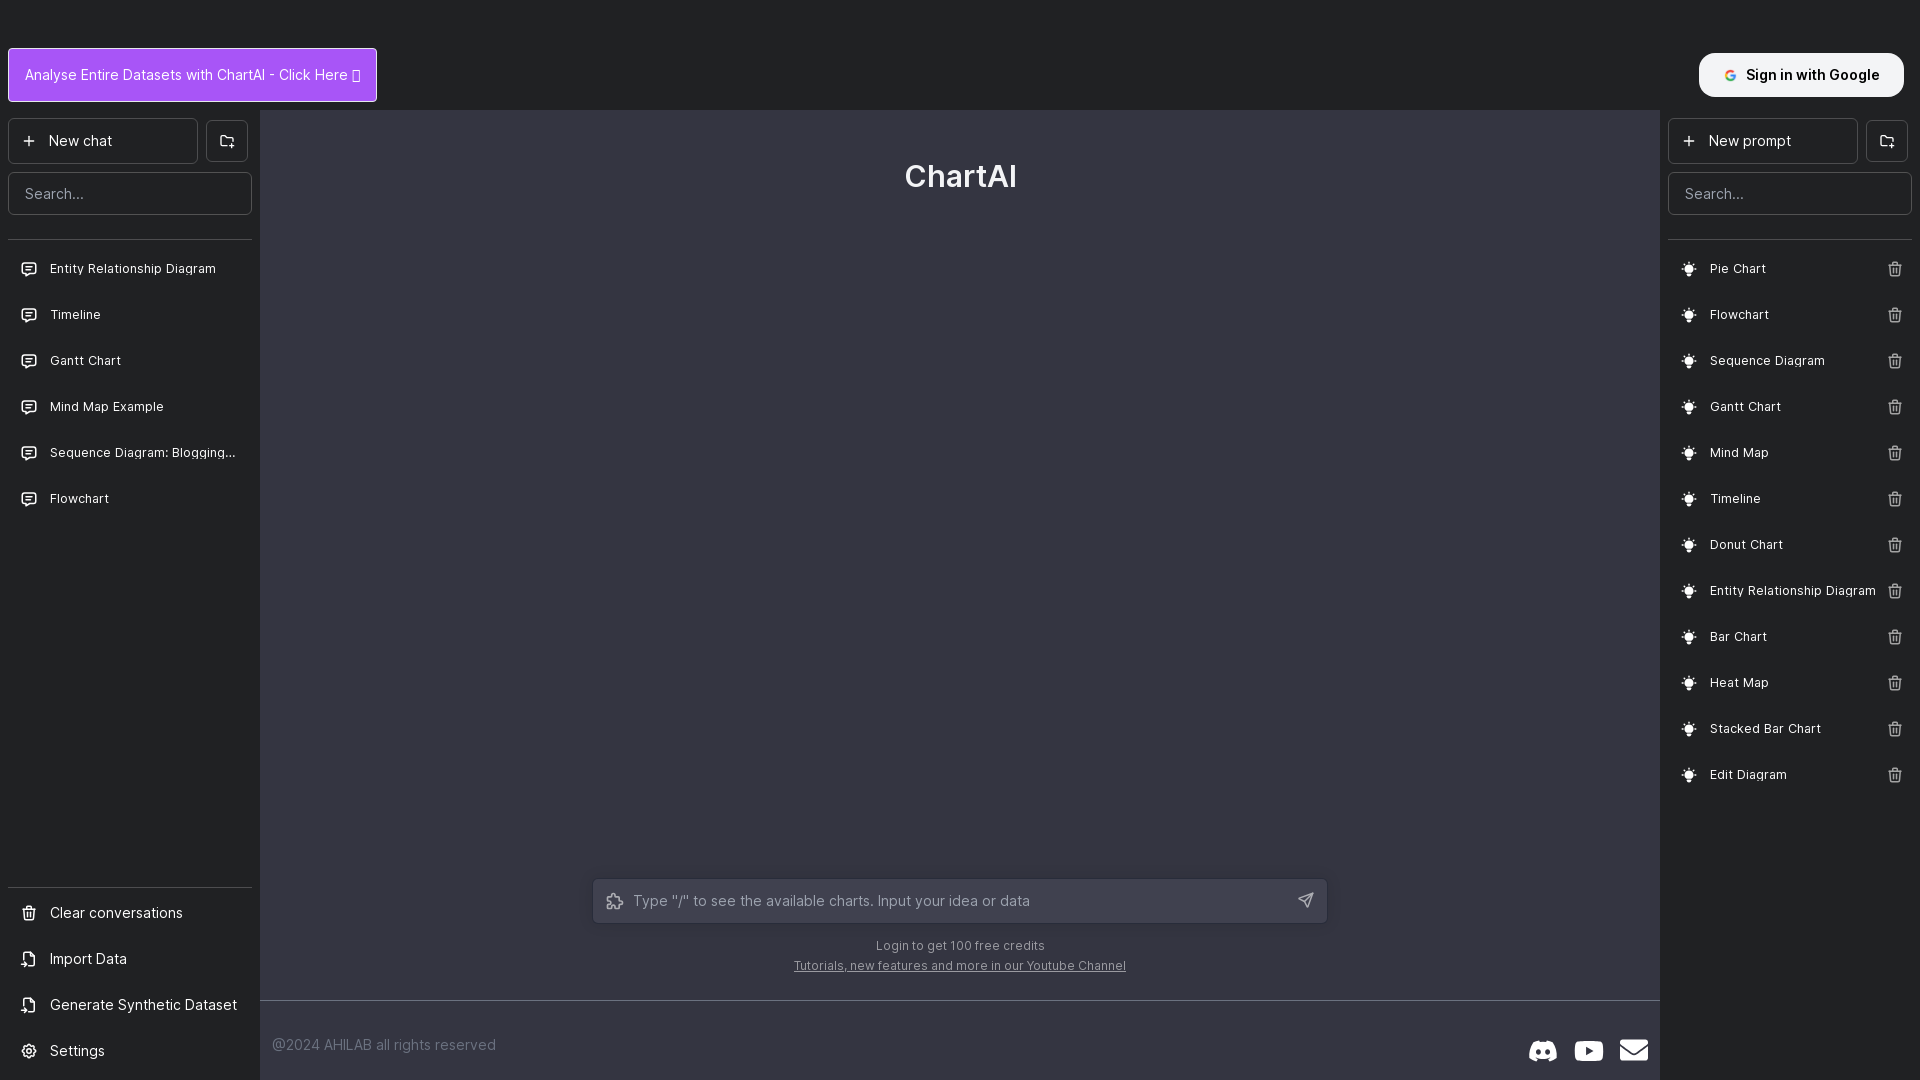
ChartAI is an innovative platform designed to help users analyze entire datasets efficiently. It leverages advanced AI algorithms to transform raw data into meaningful visual representations, making it easier to uncover insights and make informed decisions.
What are the main features of ChartAI?
- Comprehensive Data Visualization Tools
- ChartAI offers a wide range of chart types, including pie charts, bar charts, heat maps, and more, allowing users to visualize data in various formats.
- User-Friendly Interface
- The platform features a simple and intuitive interface, making it accessible for both beginners and experienced data analysts.
- Synthetic Dataset Generation
- Users can generate synthetic datasets to test and validate their analytics without compromising real data.
- Integration with Popular Tools
- ChartAI seamlessly integrates with popular data tools and productivity applications to streamline workflows.
How to use ChartAI?
Using ChartAI is simple:
- Sign Up or Log In: Create an account or sign in with Google to access the platform.
- Import Your Data: Upload your dataset from various sources or generate synthetic data.
- Choose Your Visualization Type: Select from the various chart options available.
- Customize and Analyze: Customize your chart as needed and analyze the visual representation of your data.
What is the pricing for ChartAI?
ChartAI offers a free tier with limited features and credits, perfect for casual users or those new to data visualization. Paid subscriptions are available for users who require extended features and higher usage limits, making it suitable for professionals and businesses.
Helpful Tips for Using ChartAI
- Experiment with Different Chart Types
- Don’t hesitate to try out various visualization methods to see which best represents your data.
- Use Synthetic Datasets for Testing
- Utilize the synthetic dataset generation feature to practice and refine your data analysis skills without risking sensitive information.
- Integrate with Other Tools
- Connect ChartAI with your favorite data tools to enhance your analytics workflow and streamline your processes.
Frequently Asked Questions
Can I generate images using ChartAI?
Yes, ChartAI allows you to create visual representations of data in the form of various charts and graphs, effectively generating images based on your datasets.
How many charts can I create with a free account?
Users on the free tier have access to a limited number of charts; upgrading to a paid subscription unlocks additional features and chart options.
What types of datasets can I upload?
ChartAI supports various dataset formats, including CSV, Excel files, and more, ensuring a flexible approach to data import.
Is there customer support available if I need help?
Yes, ChartAI provides customer support to assist with any issues or inquiries you may have while using the platform.
Will my data be secure on ChartAI?
Absolutely! ChartAI prioritizes user privacy and data security, ensuring all your data is protected and not shared with third parties.
ChartAI
ChatGPT for charts and diagrams.
 Google Analytics
 Next.js
 Node.js
 React
React Vercel
 Webpack
Free AI anime and manga generator. Turn text into anime episodes, manga, comics, webtoons and comic shorts in any art style — no drawing or animation skills needed.
Translate image text across 70+ languages with our advanced AI Image Translator to help you better expand your products globally to various countries
Advertised Here
Reach thousands of visitors daily. Get your spot now!
Tools similar to ChartAI
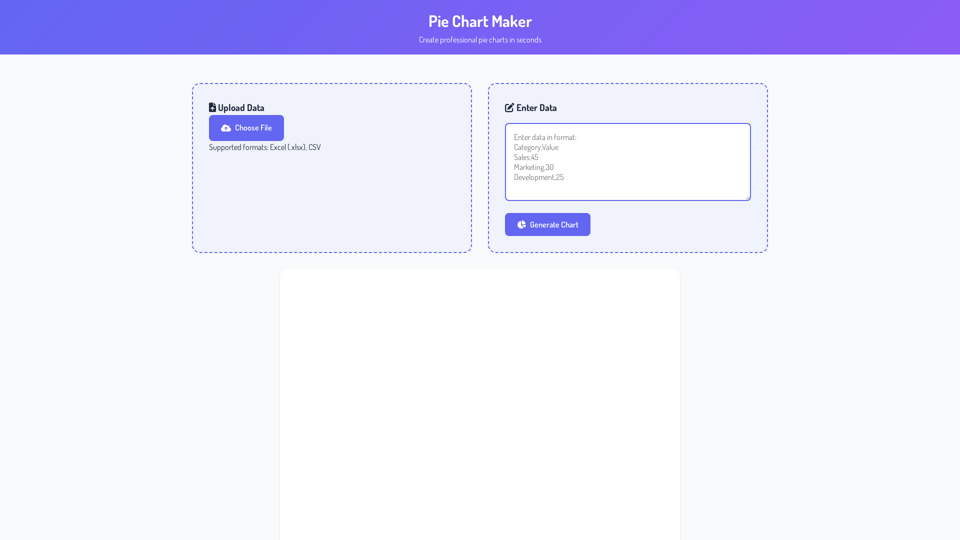
Create pie charts online for free with our Pie Chart Maker. No sign-up needed. Generate, customize, and download professional charts instantly. Data-safe, mobile-friendly, and 100% free!
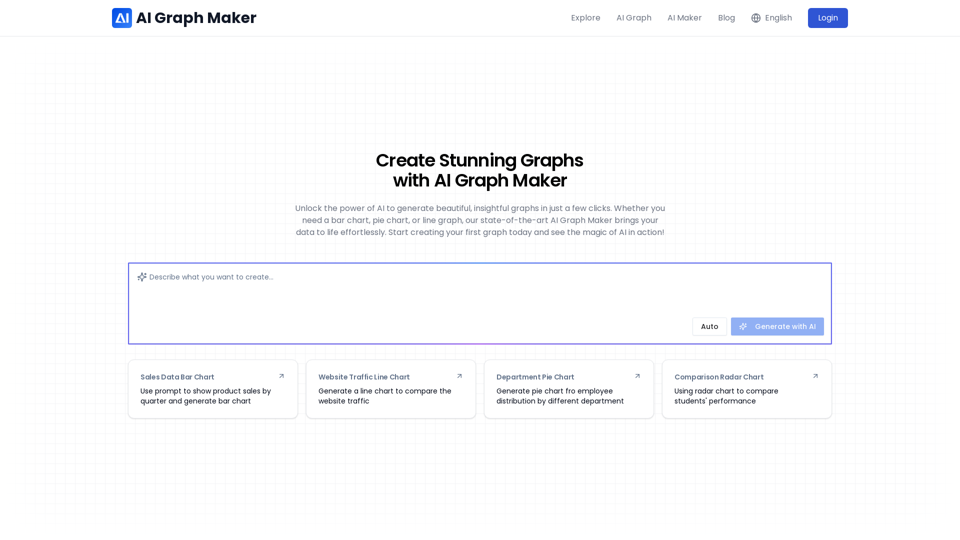
Create interactive charts with AI Graph Maker. Turn your data to custom bar charts, line charts, flowcharts, pie charts and scatter plots with AI effortlessly.
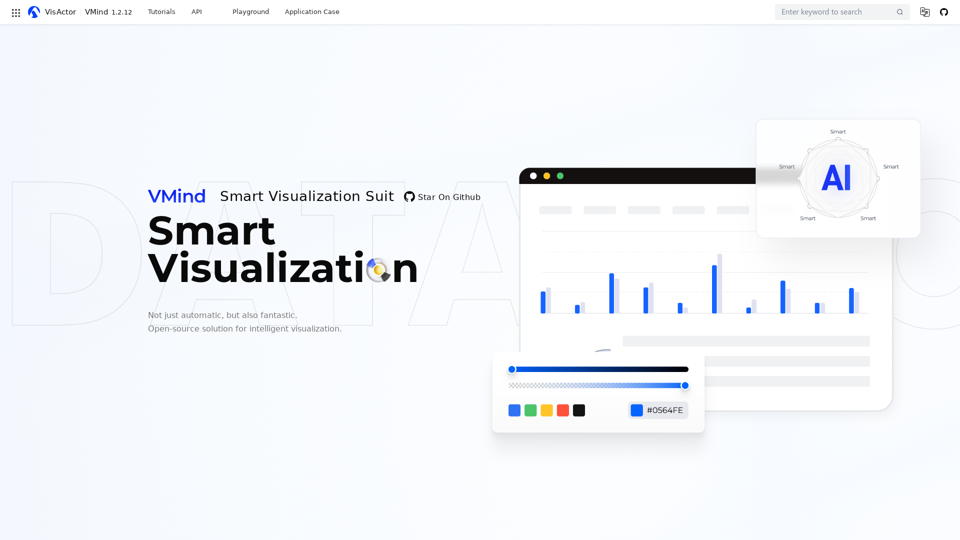
Not just automatic, but also fantastic. VMind is an intelligent visualization suit that provides intelligent interfaces through rule algorithms, machine learning, and LLM.
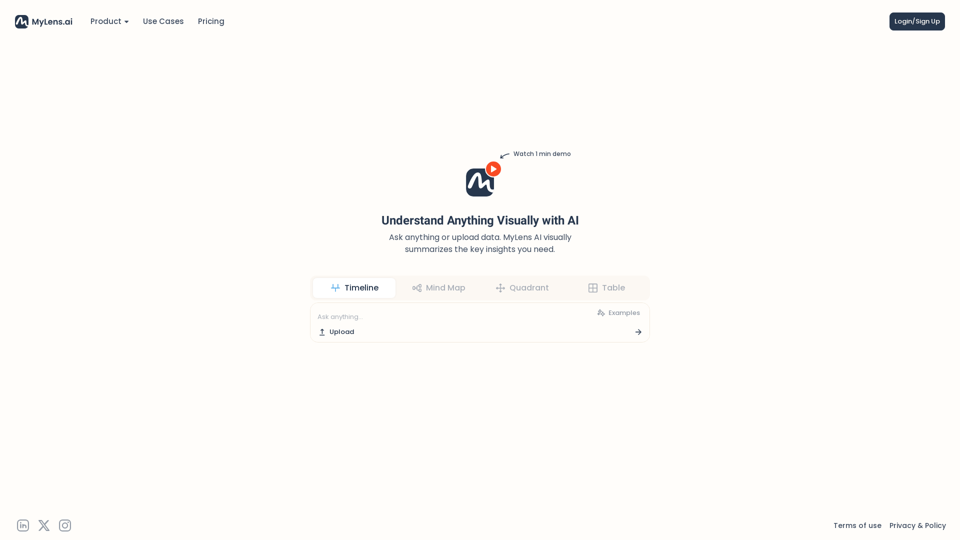
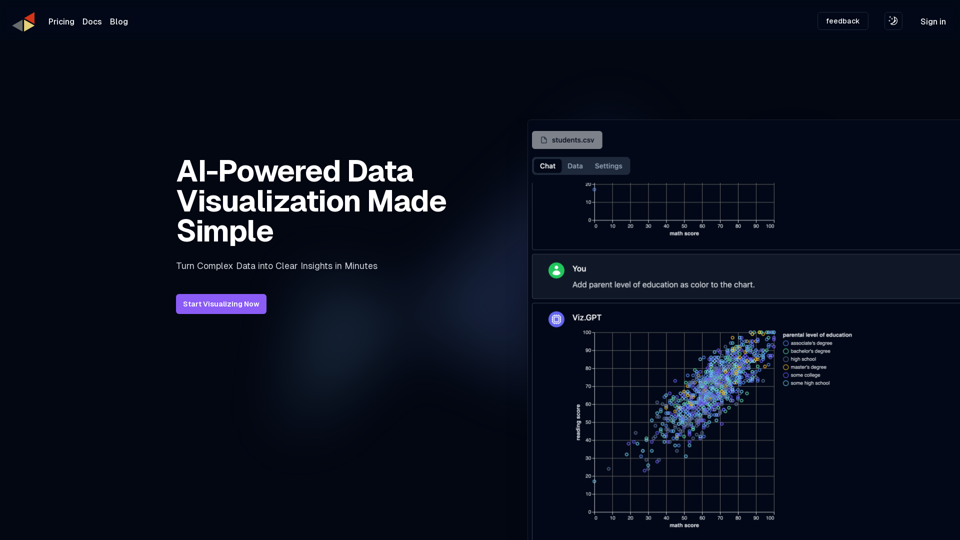
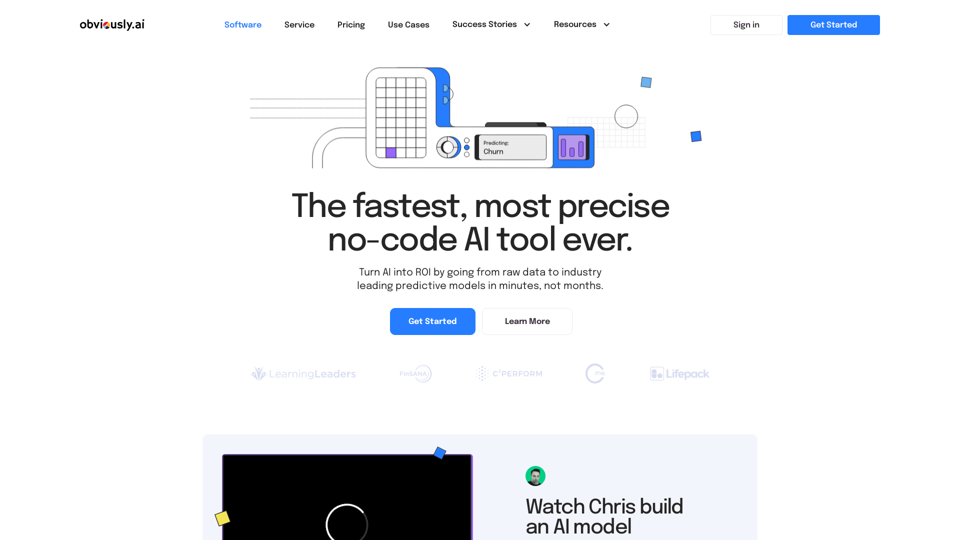
The entire process of running Data Science - building Machine Learning algorithm, explaining results and predicting outcomes, packed in one single click.
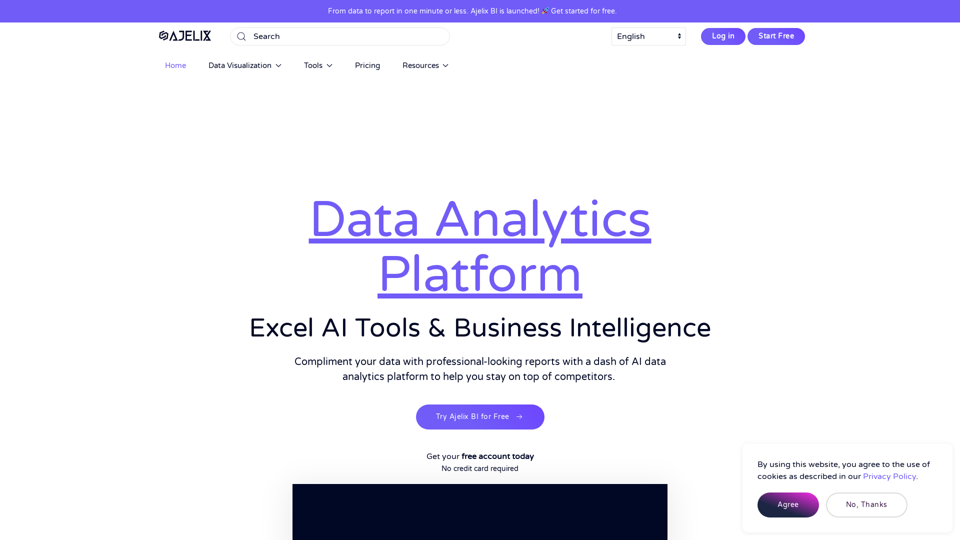
Simple data analytics platform with AI Excel tools, Data visualization, and Business Intelligence to ease business data tasks.